The 2 for 1?!
- David Robertson
- Sep 7, 2020
- 4 min read

Something that has always interested me has been the 2 for 1 idea. I've seen teams live and die by it and I've seen teams not really care about it. The idea is to maybe rush a possession in the hopes of scoring quickly to then go get a stop and then end the quarter/half with another possession. Several outcomes here:
Make a shot, get a stop, make a shot (obviously the ideal situation)
Miss a good shot, get a stop, miss a good shot
Make a bad shot, don't get a stop, miss a good shot
Miss, don't stop, make
Make, don't stop, Make
Etc.
Having worked on the Men's and Women's side of college basketball, has been fun to see some of the differences. The biggest difference is the amount of opportunities teams have to go for the 2 for 1. Since the Men play in 2 halves, they really only have one opportunity. The Women play in 4 quarters, they have three. Just from that alone you can probably imagine some stark differences. I took a dive into my team's conference to see which teams, if any, are taking advantage of the 2 for 1.
Before I show the data and explain my findings, let me give you the criteria that went into this information.
I pulled the entire season of the team's in my league (conference and non-conference play).
I looked at FGA, TOs, OREBs, PTS, and POSS. Then I calculated Points per Shot (PTS/SHOT) and Points per Possession (PTS/POSS)
I separated the data out into each quarter, each half, full game, and 1st Q to 3rd Q.
The 1st-3rd Q is what I was mainly focused on.
I looked at how each team did on offense and defensive. Then I calculated the difference between offense and defense.
The stat parameters were for anything that occurred with 55 seconds left on the game clock.
A couple of other things to note:
I only looked at this past season, so the sample size is relatively small.
I did not take into account fouling and if/how that can factor into the 2 for 1.
This is just to see if these select teams are taking advantage of the 2 for 1, NOT if it effective to go for it.
Personally, I think you can ignore the 4th quarter information, with 55 seconds left in a game, you are going to do what is needed to win.
For the color scales:
Offense - High/best numbers of these teams are in green. Low/worst numbers of these teams are in red.
Defense - Low/best numbers of these teams are in green. High/worst numbers of these teams are in red. (Since it is defense, remember you want low pts/shot and pts/poss, not high. The higher the number the more you are getting scored on).
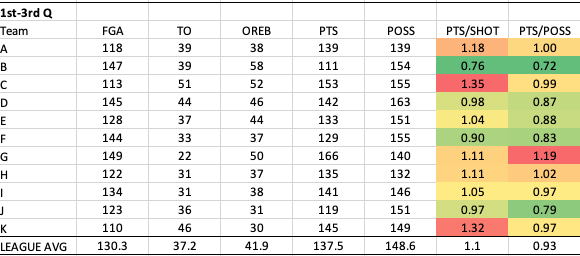
Offense Numbers

Defense Numbers

Differences (Offense - Defense)

There is a bit to digest here. But the thing that stood out the most to me was that of these 11 teams, was that none of them are really using the 2 for 1. In fact the most effective team, based off these parameters, 1st-3rd Q, PTS/SHOT, & PTS/POSS actually had the least amount of 2 for 1 possessions (TEAM B).

I thought that there might be one or two teams that had around 12-15 more 2 for 1 possessions. Another part that stood out to me was the amount of FGA by the teams. The League Average was 130.5 shots on the season in this time frame (somewhere between 4.3 shots if you played 30 games and 4.8 shots if you played 27).
Since I didn't see a huge difference in how much teams were going 2 for 1, I then turned my attention to see how effective/efficient teams were being in the last 55 seconds of the 1st-3rd quarter. Looking at this, you really start to see who is stepping up right before a break or easing up knowing the quarter/half is almost over.
You can see below and stated before that Team B is probably the best in this time frame. 1.2 PTS/POSS and 1.13 PTS/SHOT and only 24 TOs. Pretty good stat line. Team I has a good PTS/SHOT at 1.0. You would like it to be higher but nothing wrong with getting a point per shot. However, their PTS/POSS is 3rd to last. The biggest point of note is their low OREBs. They have the lowest amount by a good amount in this time frame. They are having fewer opportunities to score by not getting their OREBs like the other teams are; their possessions are getting cut short after one shot.
Defensively, take a look at Team C. About middle of the pack for PTS/POSS at .99 but the worst in PTS/SHOT at 1.35. That difference is a little big higher than I would have expected. Well take a look at their TOs (aka their forced TOs). 51 - the most while on defense. This could be interpreted a few ways. The way I see it is, they could be playing a more pressure type defense that could lead to more TOs but if they gamble and make a mistake, their opponent is taking advantage of any openings and mismatches. That could account for why their PTS/SHOT is so much higher, they could be leaving their opponents wide open for 3s or uncontested layups (they also have the 2nd least FGA).
Offense 1st - 3rd Q

Defense 1st - 3rd Q
There is a lot more that can be looked into. This was simply a small, numbers look at the 2 for 1. There are other factors that could be considered and included into the data but I think this gives a relatively good idea at how teams play in this time frame. This is definitely something I will keep a look at as the season begins.


Comments